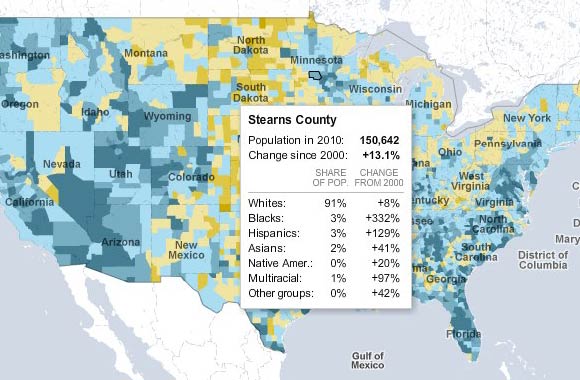
2010 Census Interactive Population and Housing Development Map

Browse population growth and decline, changes in racial and ethnic concentrations and patterns of housing development in this interactive map tool. Just hover your mouse pointer over the county. Make sure you zoom in to get more detailed view.
This is a great tool to quickly get an idea of your local demographics and it’s using the newest 2010 Census data!
View 2011 Interactive Census Map Now


